A third of this image is hiding something behind it
A maximum projection turns 236 optical sections into one picture. Across a third of the area where there is anything to see, it is stacking two separate objects into a single pixel.
A confocal microscope does not take a photograph. It takes a stack of optical sections, each one a thin slice of the specimen at a known depth, and the figure in the paper is almost always a single image made by flattening them.
This stack is 236 sections spanning 118 µm. The usual way to flatten it is a maximum-intensity projection: for every position in the image, look along the line of sight through all 236 sections and keep the brightest value. It is the right default, it is what everybody does, and it is in every imaging package as one click.
It is also a decision about what to do when two things are behind one another, and the decision is to show one of them.
How often that happens here
Along each line of sight, this counts the separate runs of signal: stretches of sections holding something, divided by stretches holding nothing. Where a line of sight crosses two separated runs, the projection has two objects to choose between and returns one.
Of the 29,949 positions in this image where there is any signal at all, 10,032, or 33.5%, hold two or more separate objects stacked behind one another. Where that happens the two are typically 33 µm apart, which is more than a quarter of the depth of the whole stack.
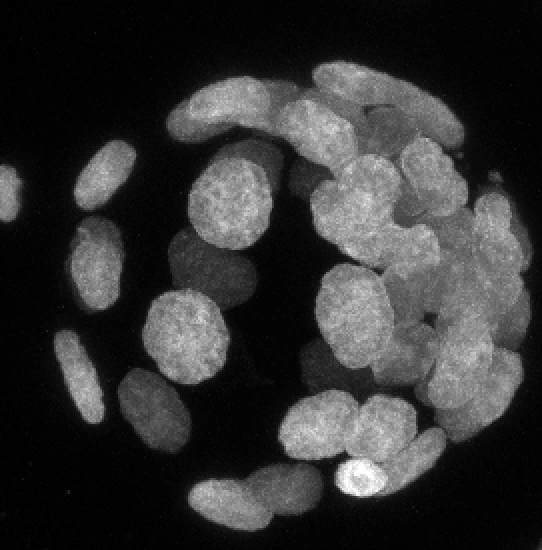
The projection
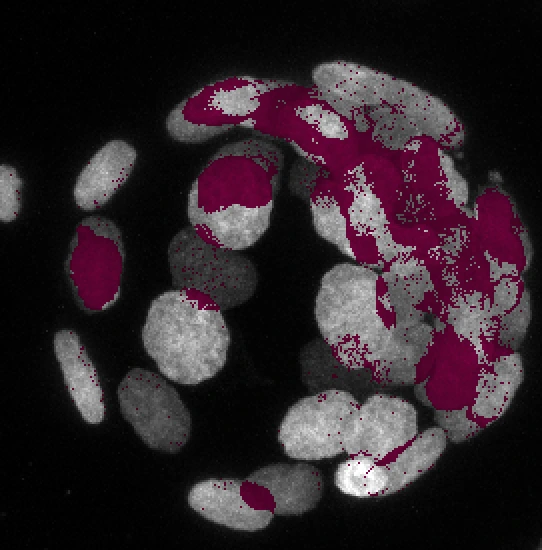
Where it fuses two or more objects
The projection, and where it is hiding something
Left: the maximum-intensity projection of the DAPI channel, which is the image a paper would carry. Right: the same picture with every position marked where the line of sight crosses two or more separate objects. Both are built from the same array in the same script, so the picture and the number cannot disagree. The marking is not a correction; the point is that the left image looks exactly as trustworthy in those places as everywhere else.
| Threshold | Value | Positions fusing two or more | Median separation |
|---|---|---|---|
| Otsu | 342 | 33.5% | 33 µm |
| 90.0th percentile | 191 | 38.6% | 38 µm |
| 95.0th percentile | 450 | 34.3% | 24.5 µm |
| 97.5th percentile | 673 | 31.0% | 16 µm |
| 99.0th percentile | 888 | 22.4% | 9 µm |
Why the threshold is in that table
Deciding that a voxel holds signal needs a threshold, and a threshold can be chosen to produce a number. So this one is not chosen: it comes from Otsu’s method, which takes it from the histogram of the stack. The table then repeats the whole measurement at four fixed percentiles either side of it.
The answer moves, from 38.6% at the loosest cut to 22.4% at the strictest. It does not stop being true. Even at the threshold that throws away all but the brightest one per cent of the stack, a fifth of the remaining image is still stacking separate objects on top of each other.
What the measurement does not say is that both objects are nuclei. This counts runs of signal along a line of sight; it does not segment anything and it does not identify what it found. Two separated runs 33 µm apart are very unlikely to be one object, and whether the second one is a nucleus, a fragment or something else is a question for whoever was at the microscope.
Seeing them come apart
An interactive view of the same confocal stack, one optical section at a time. In a single section about ten nuclei are in focus, each showing LaminB1 as a bright ring around a darker interior. Moving through the sections, nuclei appear and disappear as the focal plane passes through them, so objects that overlap in the projection are plainly at different depths. The projection view shows roughly twenty-five nuclei at once with every ring filled in.
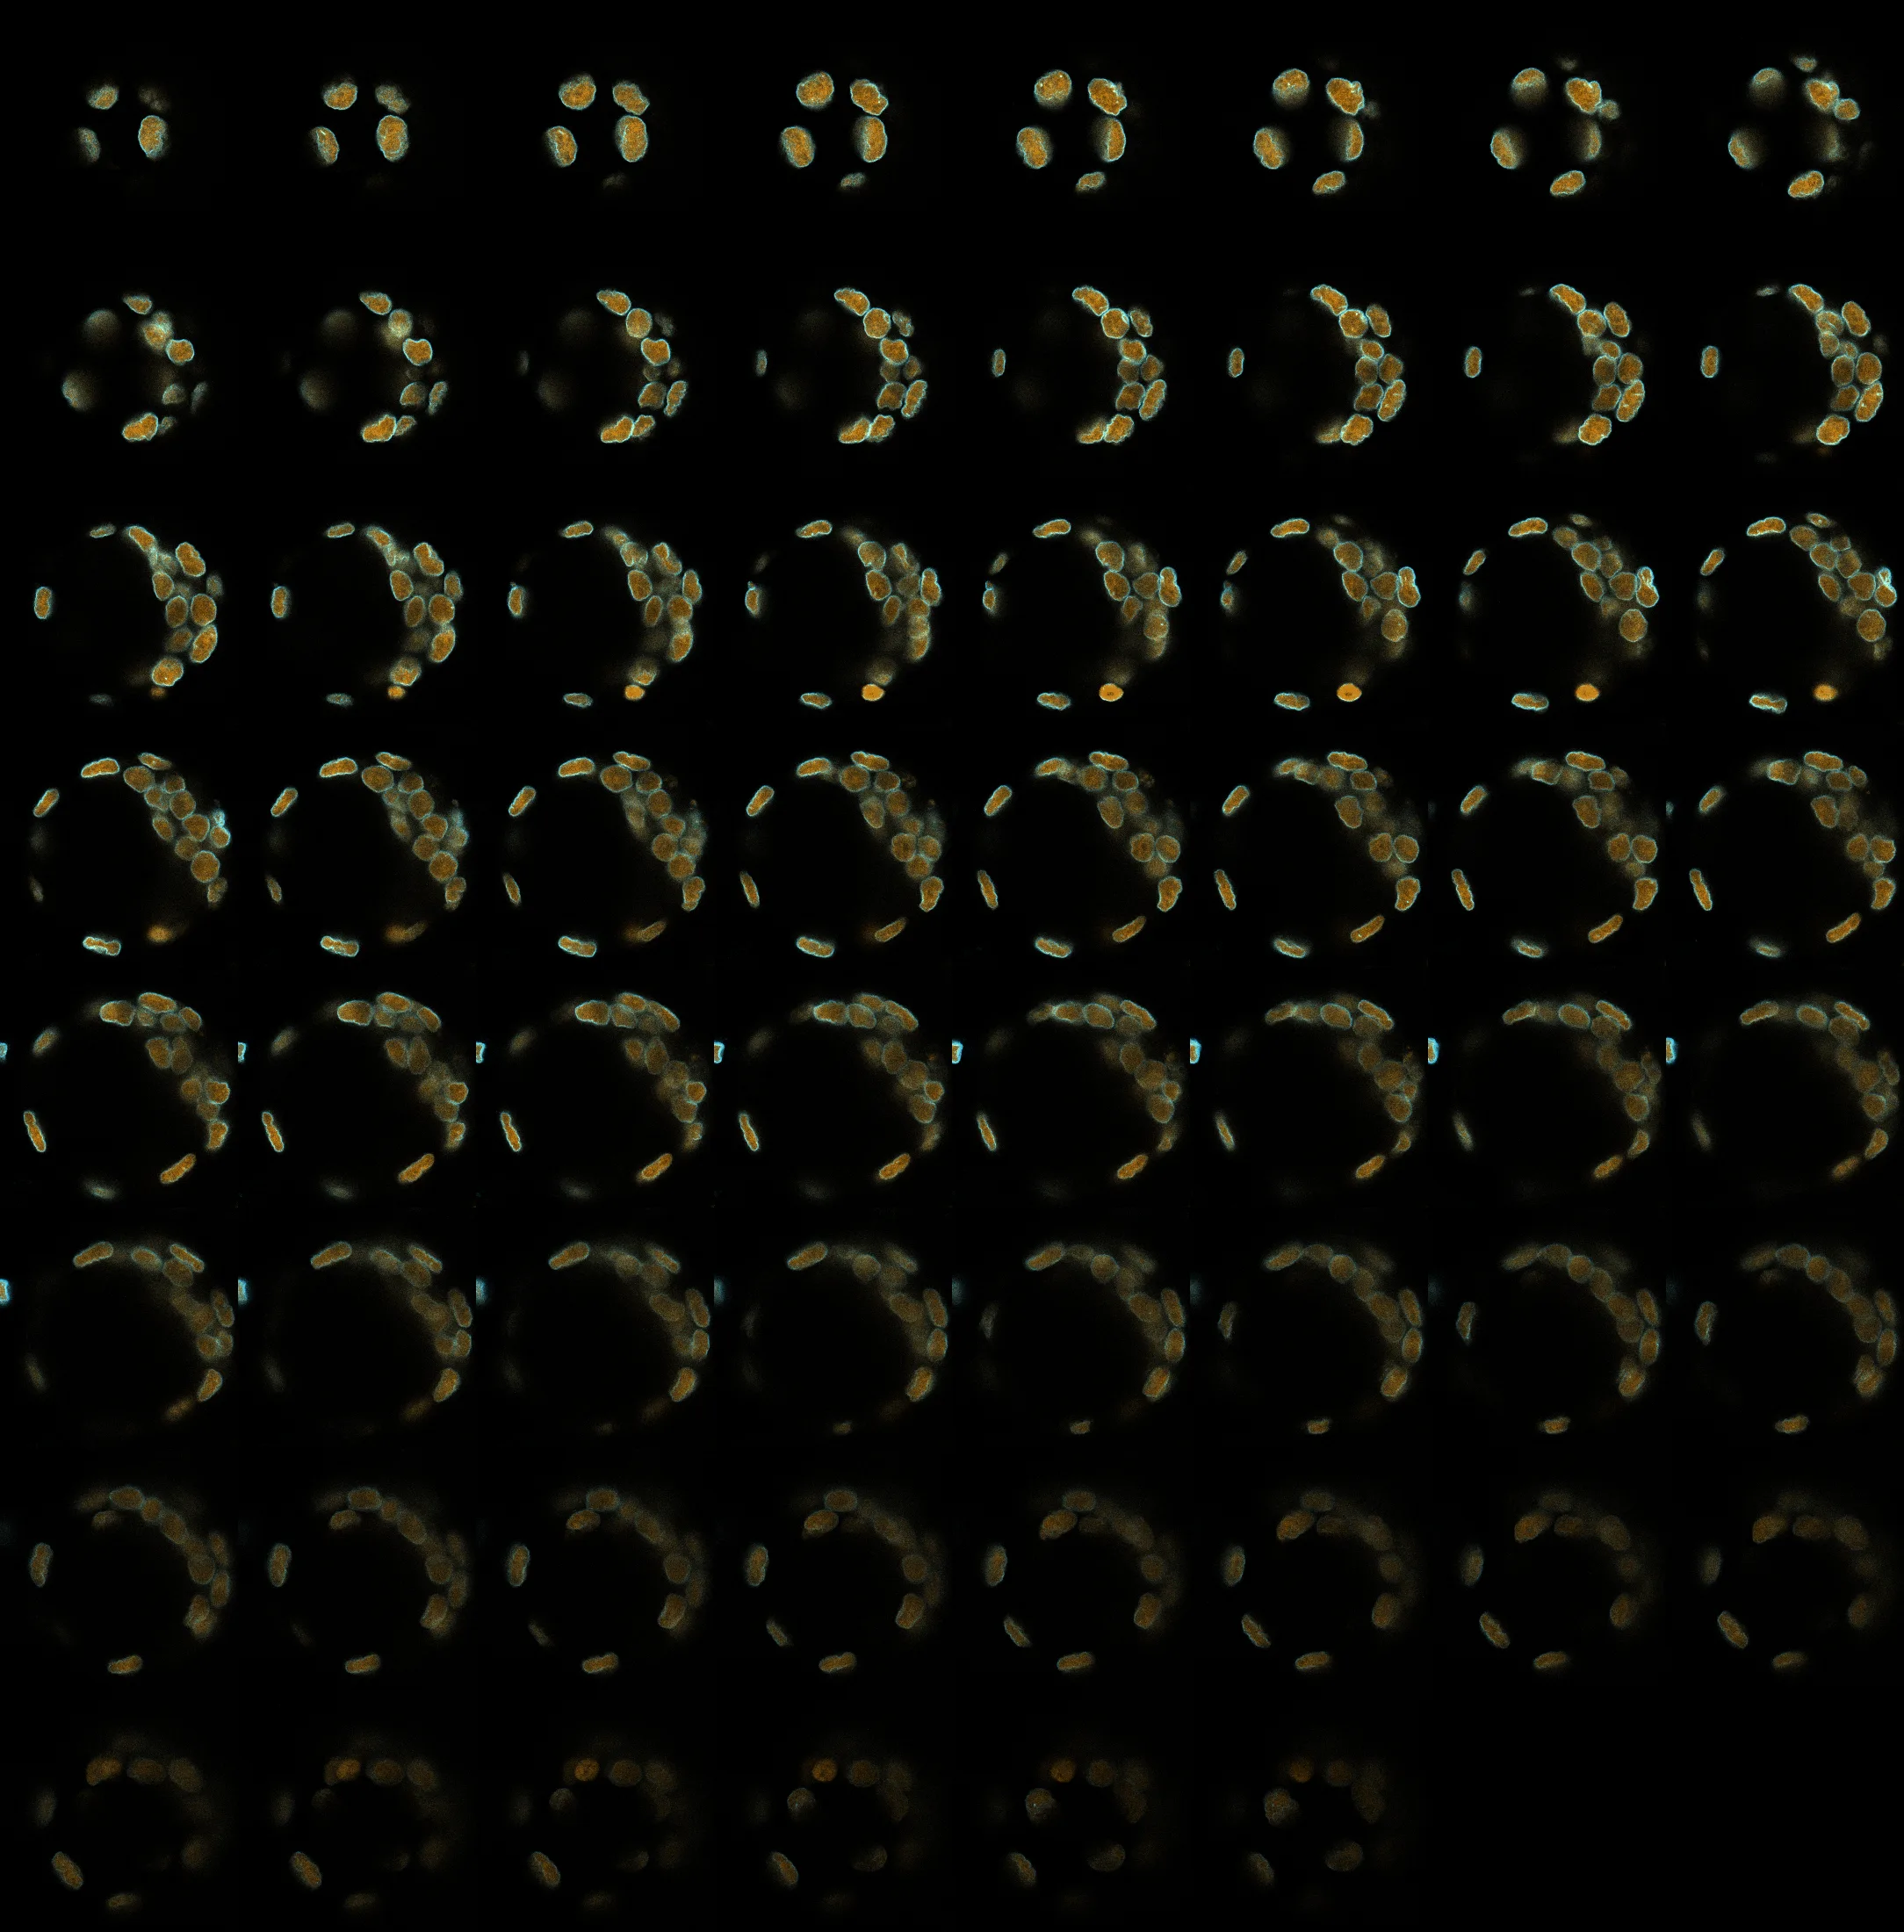
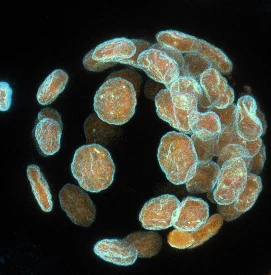
Every optical section in the stack, in order. Move through them one at a time with the slider once it appears.
The same specimen, one optical section at a time
Move through the 62 sections and the nuclei separate: at any one depth about a third of them are present and the rest are elsewhere. Switch to the projection and they return to one plane, which is the image the measurement above is about.
What this is not an argument for
Not for abandoning projections. A projection is how you show twenty-five nuclei at once, and the alternative on paper is twenty-five panels nobody will look at. The authors of this study deposited the whole stack, which is the thing that made any of this checkable, and that is the standard worth copying.
It is an argument about what a projection is. Not a summary of the stack, and not a photograph of the specimen: a specific reduction that resolves every collision silently and in the same direction. What it discards is not dimmed or blurred at the edges. In 33.5% of the image, something is simply not there, and nothing in the picture says which part.
The stack is deposited and openly licensed. If a figure matters enough to argue about, the sections behind it can be opened and looked at, which is a thing that was not true of published microscopy twenty years ago and is quietly true of a great deal of it now.